India Heat Vulnerability
Heat waves in India are becoming more frequent and more intense as a result of climate change, posing a growing risk to millions of people. This website aims to show how vulnerable different regions in India are to heat. For this purpose, a Heat Vulnerability Index was developed. This index combines population and heat, which together form the hazard level, as well as land use, which can either worsen or mitigate that hazard.
Map.
This interactive map presents a Heat Vulnerability Index for India, together with the three layers it is built from. The index combines population and land surface temperature, which form the heat hazard, with land use, which can either intensify or reduce that hazard. The map was created in QGIS. Each layer was styled with a graduated colour ramp and a labelled legend, and an OpenStreetMap basemap was added for context. The project was then exported with the qgis2web plugin using the Leaflet framework, producing a standalone web map with a layer switcher, legend, address search, measurement tool and location control.
Context.
The Spatial Data Science course was offered as a master‑level, 4 hours‑per‑week practical methods program during the summer semester of 2026 at the University of Cologne, Institute of Geography, and was conducted in English to accommodate international students enrolled in the IMES and JIMES programmes.
Its overarching aim was to introduce and teach advanced methodologies and applications in spatial data science, and to enable students to apply these techniques within a substantive project. Originally, the curriculum was organized into a weekly 2‑hour seminar—dedicated to the presentation of theory, methods, and technological tools—and a complementary 2‑hour laboratory session for hands‑on implementation. However, due to the low enrolment of only five participants, the instructional design was revised to adopt a more interactive and collaborative format that better suited the cohort size. The redesigned course simulated a small start‑up environment in the field of spatial data science, tasking the participants with delivering a complete project by the end of the semester . Within this framework, a “new‑work” approach was employed, emphasizing collaborative, distributed, and asynchronous task execution, and incorporating version‑control and project‑management tools such as Git and GitLab. Project coordination followed AGILE principles; weekly stand‑up meetings were held during the originally scheduled Friday‑10 h seminar slot, conducted either in hybrid mode or via online video conferencing (Zoom), and a dedicated group chat facilitated ongoing communication.
The student team elected to develop a Heat Vulnerability Index for India based on publicly available geospatial datasets and to visualise the results through an interactive web map. This applied project served both as a pedagogical instrument for mastering spatial analysis techniques and as a concrete deliverable illustrating the practical relevance of spatial data science methodologies.
GIS Analysis.
The India Heat Vulnerability Index (IHVI) was designed to assess and map patterns of urban heat vulnerability across India. By integrating three critical dimensions—population density, land surface temperature (LST), and land use/land cover (LULC)—the index identifies priority zones for heat adaptation and urban planning interventions. The project provides a foundational spatial tool for policymakers to understand where thermal hazards and human exposure intersect, allowing for more targeted climate resilience strategies.
The methodology employs a sophisticated approach that measures vulnerability through the lenses of exposure, hazard, and sensitivity. Using high-resolution (1 km) satellite-derived data from the MODIS instrument, the index calculates thermal hazard intensity and accounts for how the built environment modifies that heat. For instance, the model captures how urban built-up areas amplify heat while vegetated areas provide cooling, all while layering in population density to ensure that the human impact of heat stress is accurately represented. This integrated framework offers a scientifically grounded way to pinpoint areas where high temperatures and dense populations create the greatest risk.
The Index is computed using the following formula:
Vulnerability Formula:
Where:
- P_norm = Normalized population density (0-1)
- T_norm = Normalized land surface temperature (0-1)
- L_norm = Normalized land use/cover sensitivity (-1 to +1)
A detailed technical decumentaion of the India Heat Vulnerability Index can be found from here. The Jupyter Notebook for computing the Index can be found here, and the GIS dataset of the IHVI can be found from here.
The three input datasets for population density, land surface temperature and landcover are described below in more detail.
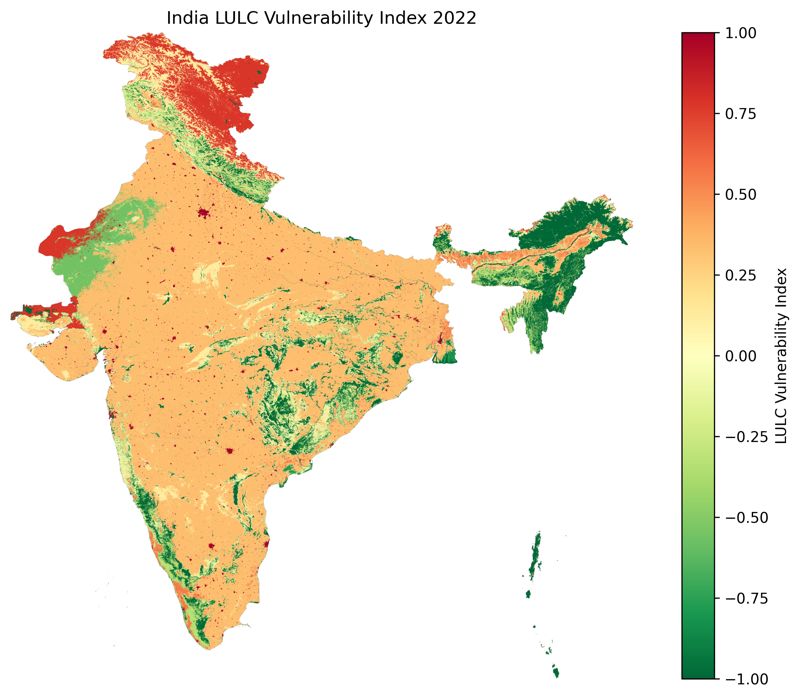
Landuse (LULC)
This dataset shows the spatial distribution of land use and land cover (LULC) across India for the year 2022. The dataset is based on NASA’s MCD12Q1 Version 6.1 annual Land Cover Type product, derived from MODIS satellite observations and widely used for large-scale land cover and environmental analysis. The dataset has a native spatial resolution of 500 metres. The original MODIS land cover classification was reclassified into 16 LULC classes relevant to the heat vulnerability assessment, with each class assigned a vulnerability weight based on its potential influence on heat exposure and thermal conditions. The data were obtained through the Google Earth Engine (GEE) platform and clipped to India’s administrative boundary. The reclassified LULC values were then normalized to a −1 to +1 scale to represent their relative contribution to vulnerability and were incorporated into the heat vulnerability assessment alongside population and Land Surface Temperature (LST) data.
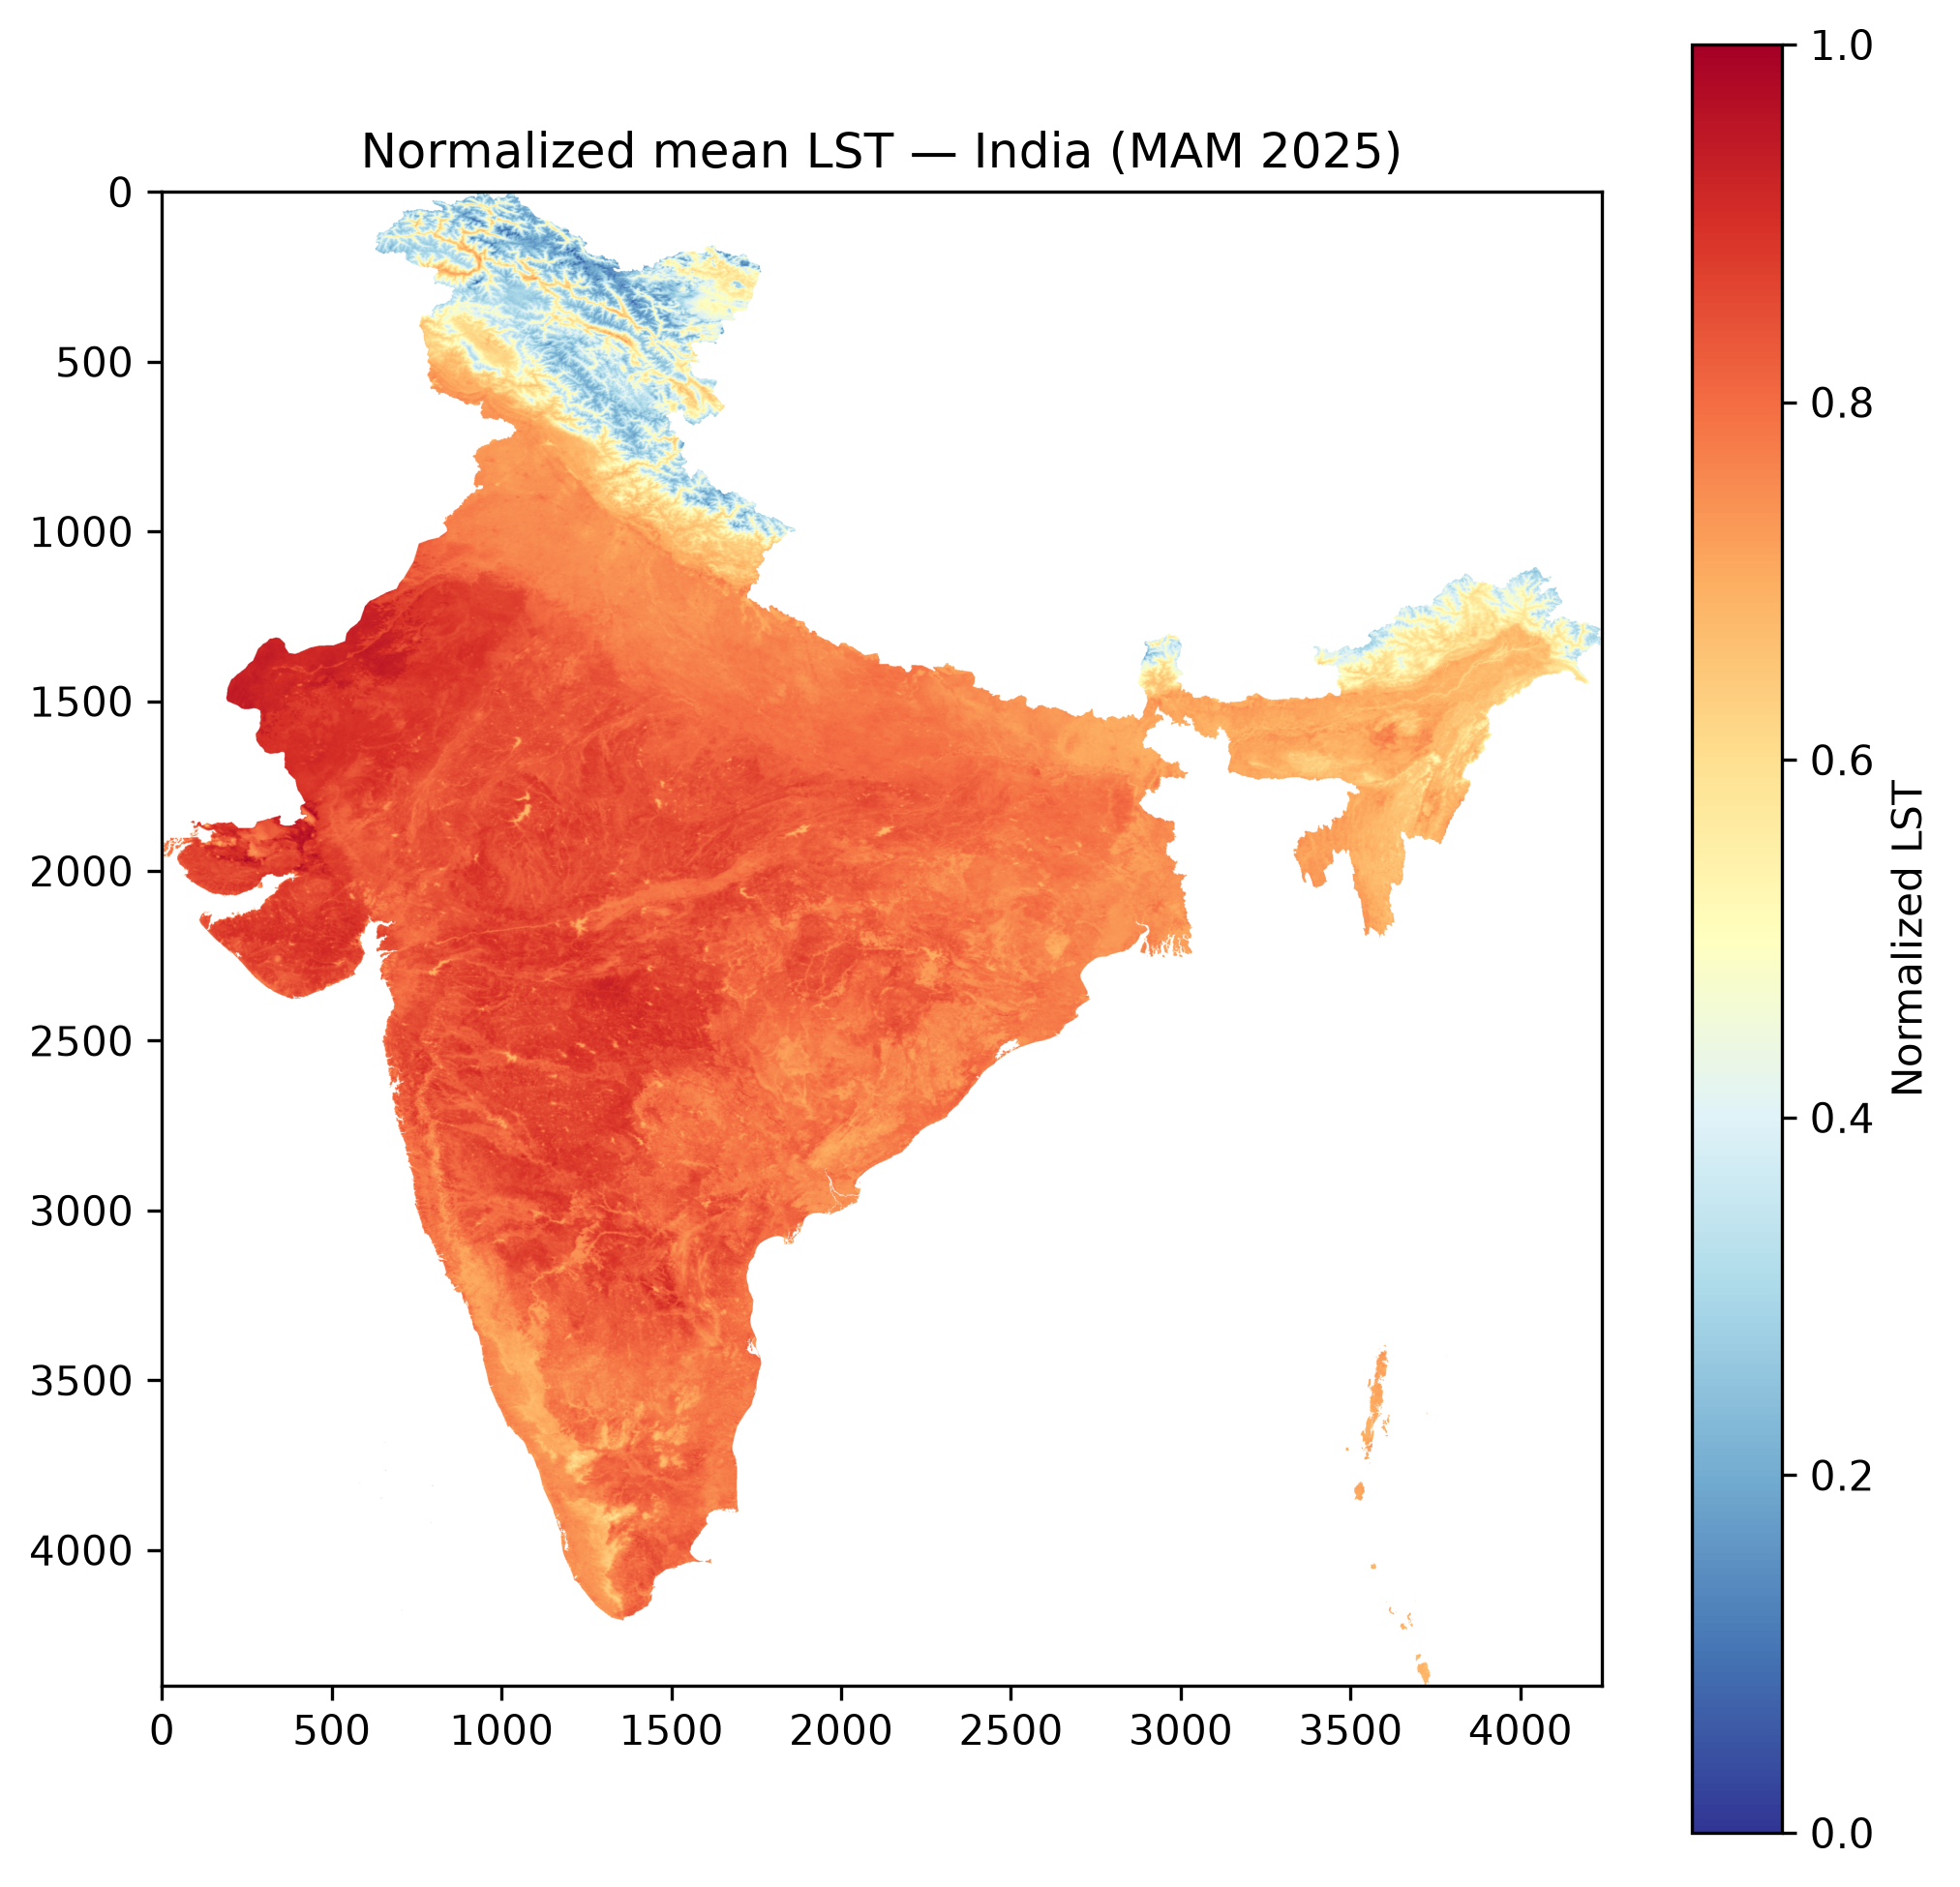
Land Surface Temperature
This dataset shows the mean land surface temperature (LST) across India for the end of spring and summer periode (March–May) 2025. The dataset is based on NASA's MOD11A2 product, an 8-day composite Land Surface Temperature dataset obtained via the earthaccess API from NASA Earthdata. This data is derived from MODIS satellite observations, making it a widely used source for surface temperature and thermal hazard analysis (Phan and Kappas, 2018). The dataset used has a native resolution of 1 kilometer. Averaged across all 12 available 8-day composites for the season, the raw temperature values across India range from -20.63°C to 46.57°C before processing. The data was clipped to India's administrative boundary and min-max normalized to a 0–1 scale to be used in the heat risk assessment alongside other datasets.
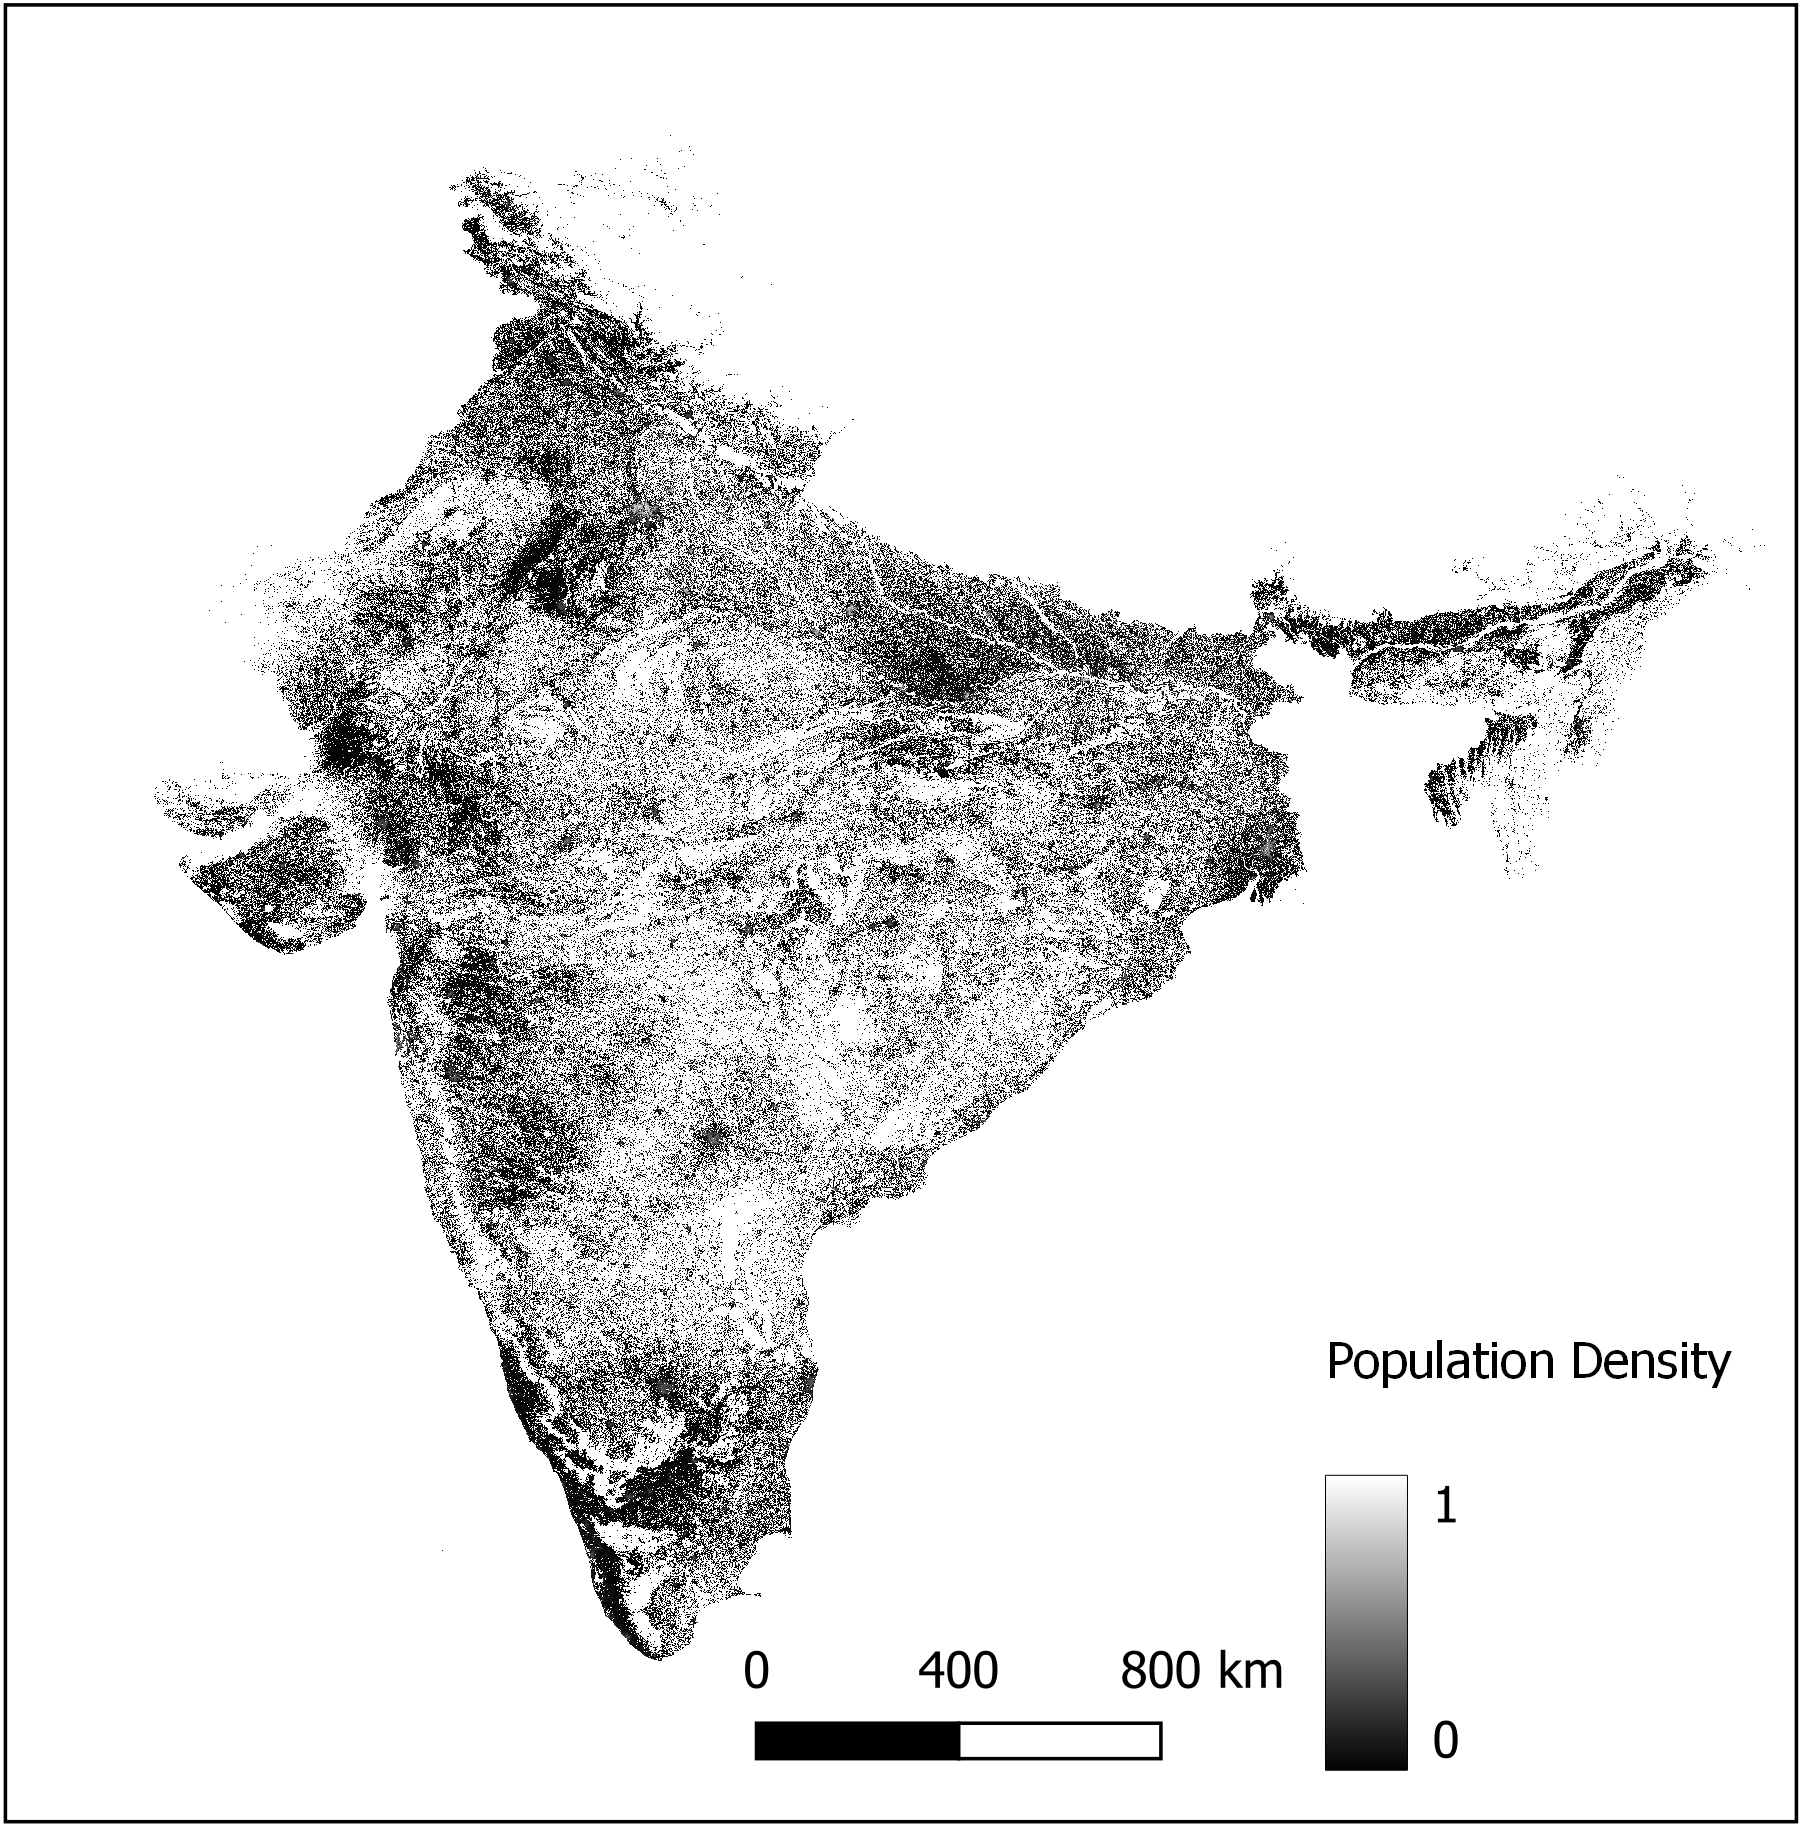
Population Density
This dataset shows the population density of India. The dataset is based on the WorldPop population count dataset for 2025, obtained from worldpop.org. This data is derived from satellite imagery, census data and surveys, making it a widely used source for population-based spatial analysis (Tatem, 2017). The dataset used has a resolution of 100 meters. The total population count of the dataset lies at 1,457,579,217 people. The data was normalized to be used in the Vulnerability Index with the other data sets. Population density is a key indicator of vulnerability, as densely populated areas face greater exposure to hazards and higher potential impact in the event of a disaster (Li et al., 2022).
Conclusions.
The Spatial Data Science course, held during the Summer Semester 2026 at the University of Cologne's Institute of Geography, successfully provided students with advanced training in geoinformatics and geographic data science. While originally planned as a traditional seminar and practical lab course, the course was redesigned into a more interactive, startup-simulated environment to better suit its small cohort of five students.
Through this applyed "new work" approach, students gained hands-on experience in a collaborative, distributed, and asynchronous working environment. By utilizing Agile methodology—including weekly "Stand-Up" meetings—and professional project management tools such as git and gitlab, the course bridged the gap between theoretical spatial analysis and professional software development workflows.
The practical cornerstone of the course was the development of the India Heat Vulnerability Index (IHVI). Using Python, Jupyter, and advanced GIS tools, students integrated complex datasets—including population density, land surface temperature, and land use/land cover—to create a spatial tool that identifies high-risk heat zones. For presenting the created GIS datasets and our work, this website including an interactive webmap was created using QGIS and qgis2web Plug-in. Ultimately, the course equipped students with state-of-the-art skills in applied spatial analysis, data science workflows, and collaborative Open Science practices.
Powered by w3.css